Scientific figures · 과학 도해
BioCanvas draws from a catalogue of scientific illustrations that were checked by a person before you ever placed one. Nothing is invented at render time, so nothing arrives with six chambers in the heart or a garbled label on the axis.
No sign-up, no card · upload an image and try it below
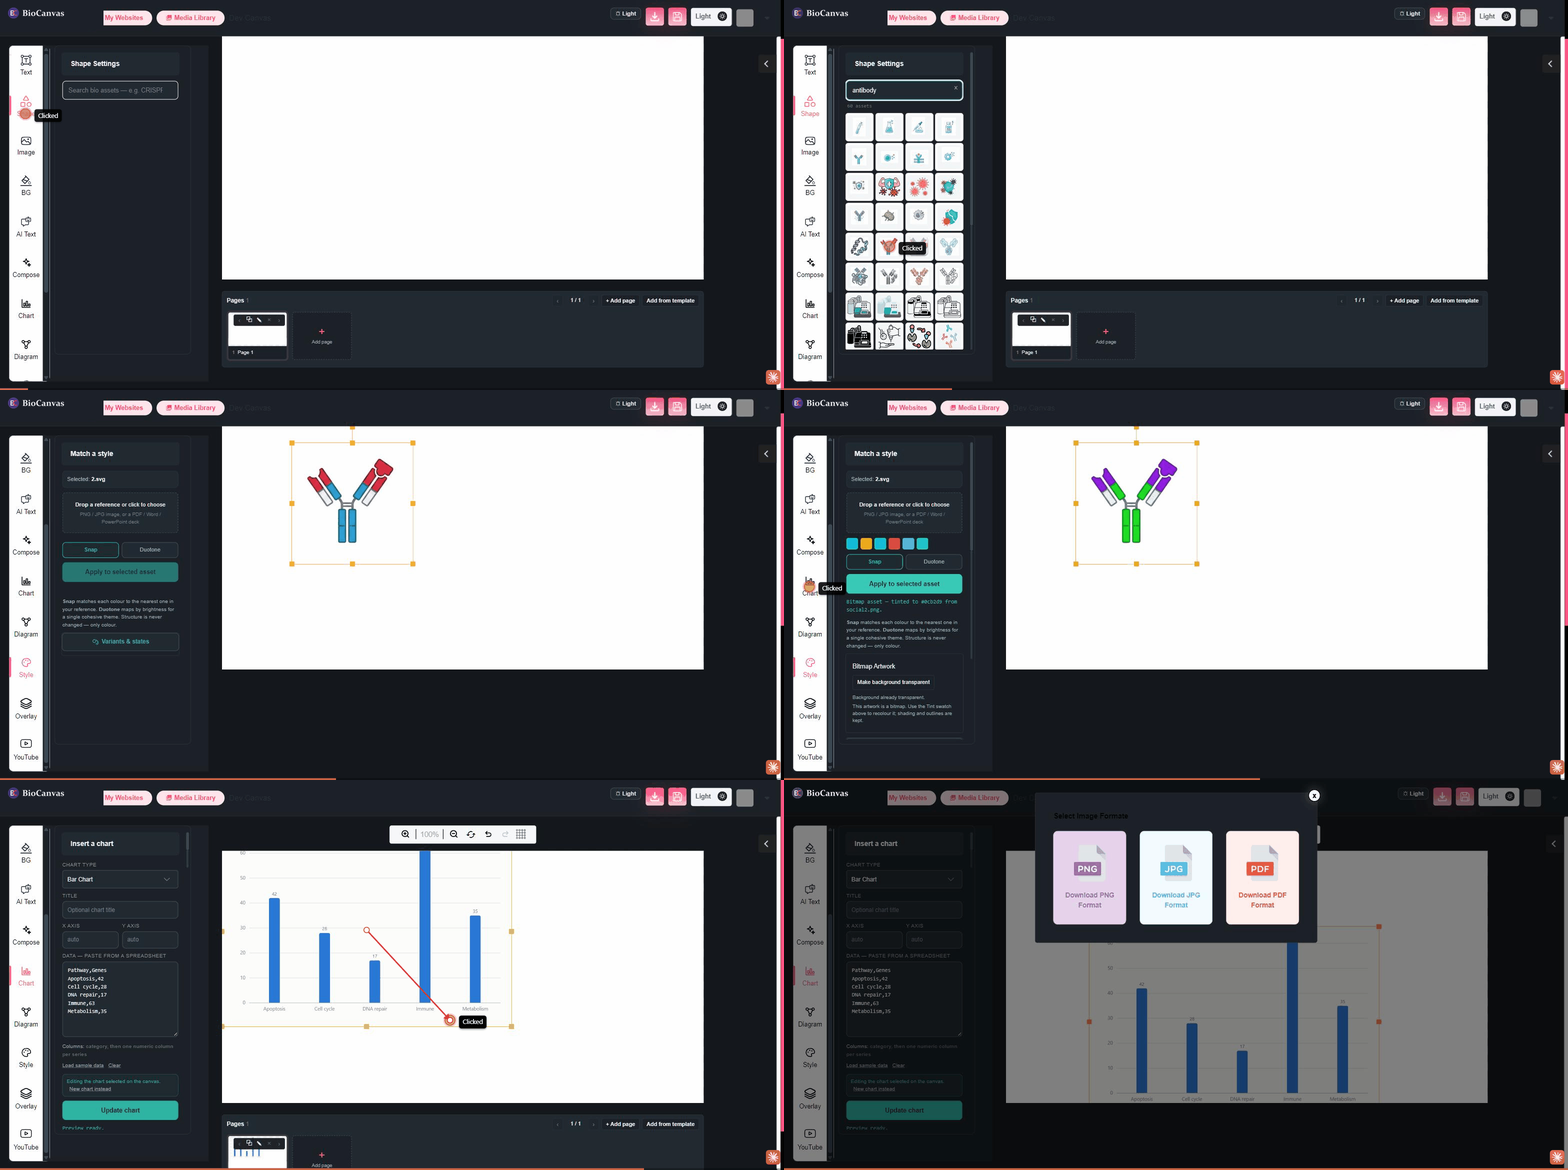
Figure 1. Four things you can put on a canvas in BioCanvas — a catalogued cell, a chart built from your own table, a structure drawn from SMILES, and a trial flow. All vector, all recolourable.
This runs the same recolour engine as the editor, right here in your browser. Nothing you upload leaves this page, and there is nothing to sign up for. Want to see the rest of the editor first — text, charts, pages, export? Watch the two-minute tour.
Drop an image here, or choose one — a photo, a chart export, a screenshot of a figure. It stays on your device.
Drag it anywhere on the canvas.
Runs entirely in your browser · nothing is uploaded · no account needed. Want templates, the full library and saved projects? Start free.
Image generators invent structure. That is fine for a book cover and disqualifying for a figure a reviewer will read. BioCanvas takes the other route.
A model produces something cell-shaped. Organelle counts drift, membranes fuse, and text renders as letter-like marks. Nothing carries a source, so nothing can be checked — and a figure you cannot check is a figure you cannot defend in review.
Every illustration sits at a known place in a scientific taxonomy, carries its source, and was looked at by a person before it shipped. Place one and it stays exactly what it is — recoloured, reoriented and relabelled, never redrawn into something else.
Not a search box over a pile of clip art. Every element has a position in a four-part taxonomy, so you find things by what they are.
Genetic systems, proteins, cells, tissues, organs, organisms and populations.
Molecular structures, representations, conformational states and reactions.
Conditions, diagnostics, interventions, devices and care pathways.
Instruments, assays, methods, sample handling and readouts.
Each one is a flat, transparent vector — recolour it to your journal's palette, flip it, strip the labels, switch it to a light or dark background, and it stays crisp at any size.
Copy straight out of your spreadsheet — commas, semicolons or tabs, quoted fields, header row or not. BioCanvas reads the shape of your data and maps it onto the chart that fits. Colours come from a palette tested for colour-vision deficiency, so your figure survives a greyscale print and a reader who sees red and green alike.
Caffeine, warfarin, serotonin, your own compound — BioCanvas lays out the 2D skeleton and then checks its own work, looking for overlapping atoms and crossing bonds before it hands the structure over. If it cannot lay a molecule out cleanly, it says so rather than give you something a chemist would have to correct.
Activation and inhibition are not two arrowheads you have to remember to swap. Mark an edge as inhibition and it renders as a T-bar, every time, because the renderer enforces it. Layer bands, compartments and annotation callouts come from the same set.
Multi-panel figures on a shared baseline grid, conference posters, slides, and trial documents including CONSORT flows and protocol diagrams. Panel letters, alignment and spacing are handled, so a reviewer reads your result instead of your layout.
Every image below is a real render from the tools described — not a mock-up of one.
Most scientific clip art is a photograph of a drawing — a bitmap in an SVG wrapper. You cannot recolour it, and it goes soft the moment a journal asks for 300 dpi. Each library entry is retraced into flat vector paths on a genuinely transparent background, reproducing the original's placement so it drops in as a direct replacement.
Source (left) beside its vector master (right), on transparency. Genomic DNA, mitochondrial DNA, chromosomes, chromatin, protein-coding genes.
One entry is not one picture. Colour mode, orientation, labelled or unlabelled, and biological state are parameters applied by rule, so the activated form of an illustration is the same illustration — not a second drawing that drifted from the first.
One base illustration. Top: colour mode and orientation transform the artwork. Bottom: the four states tint it and add a status badge, leaving the drawing itself untouched.
Point at a figure whose look you need to match — a journal's palette, a slide deck, a grant template — and the palette is extracted and applied. Structure is untouched. Only colours and line style change, so a restyled molecule is still the same molecule.
Example image → extracted palette → the same illustration in that palette. Checkerboard marks transparency.
Charts are computed from your numbers, not drawn by hand and not invented. Paste a table, pick a shape, and it is on the canvas as vector — axes, error bars, legend and a palette that survives greyscale printing.
The chart panel — paste, preview, place.
Output from the same renderer. Taxonomy codes are the chart types they satisfy.
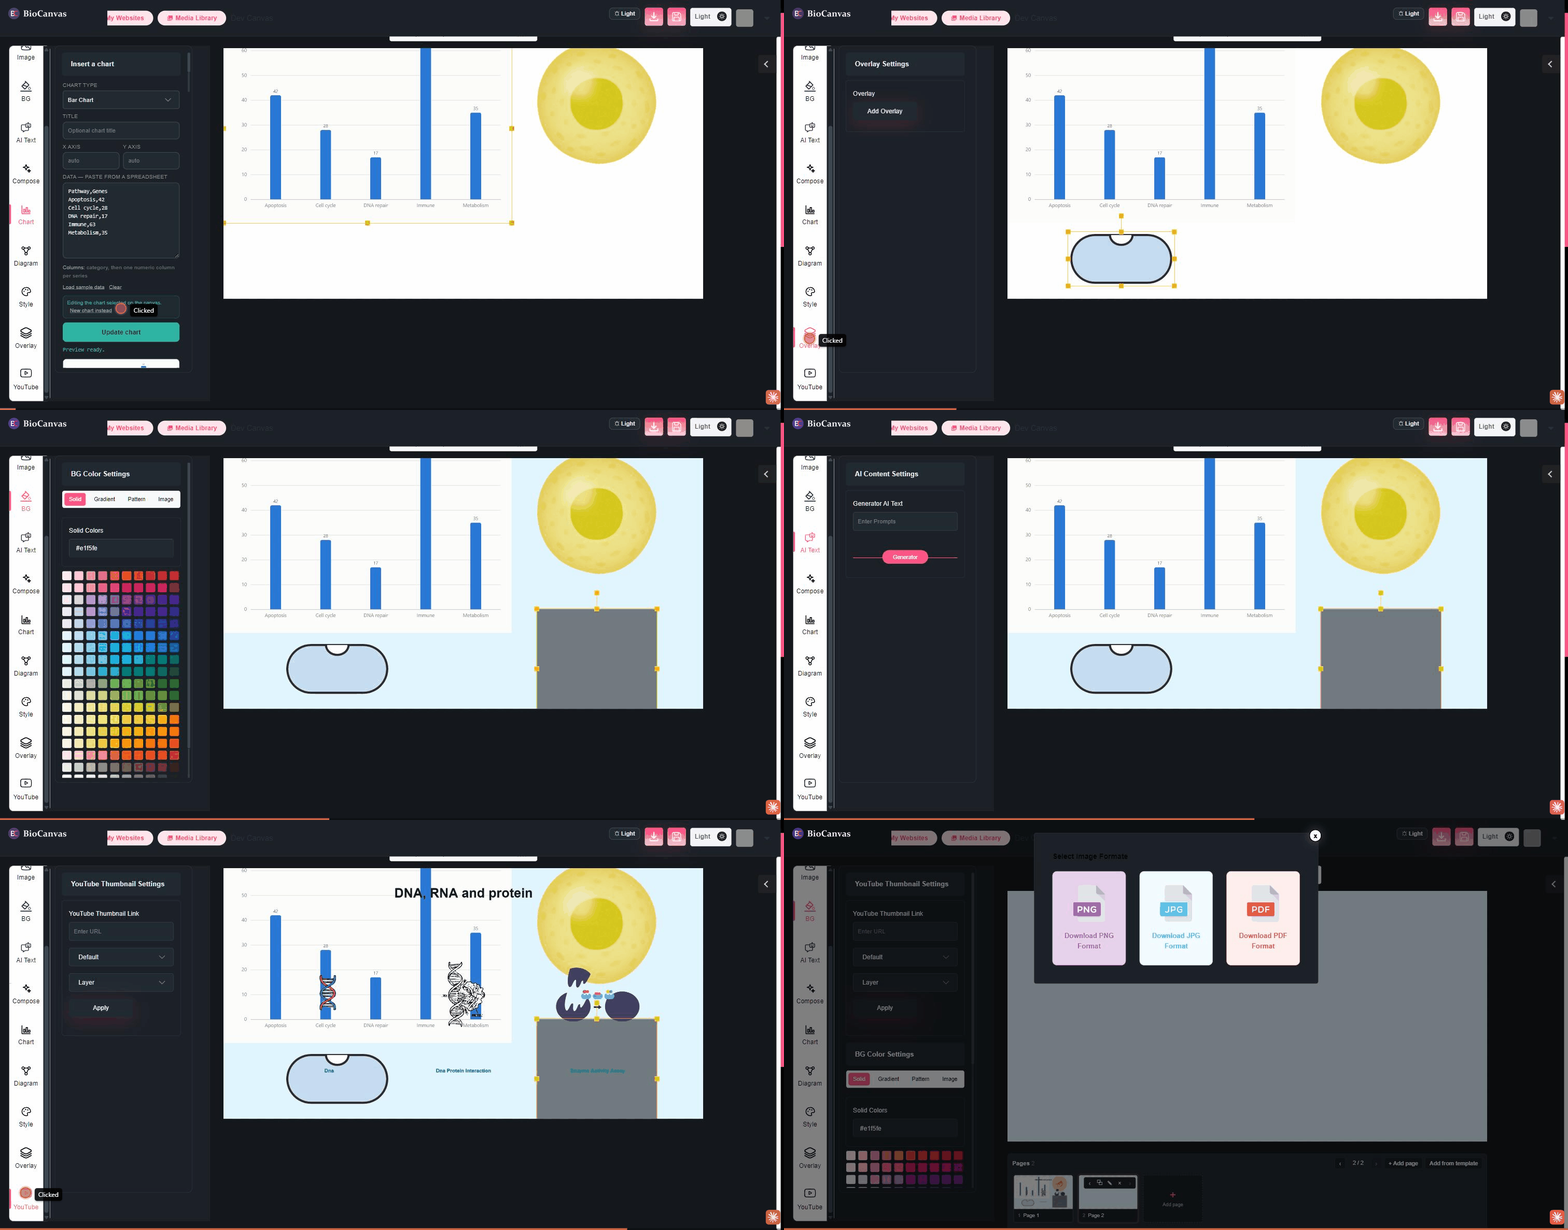
No recording tricks — this is the actual application. Watch the whole pass, then try the recolour-and-place moves yourself in the sandbox below.
Drop in a heading, then open the image panel — upload your own photo or generate one with AI.
Type what you need, place it, then point at any image and lift its palette — structure stays, only the colour changes.
Paste a table for a vector chart, build a pathway or a CONSORT flow node by node, then layer an annotation overlay on top.
Set a page colour, add a page for a multi-panel figure, and preview Compose, AI Text and the YouTube-thumbnail panel.
PNG, JPG or publication-ready PDF, whenever the figure is ready.
Type "antibody" and every result is a checked vector — not a generated guess.
Place the illustration, then point at a journal figure or slide deck — the palette is lifted and applied, structure untouched.
Numbers in, vector chart out — axes, labels and a palette that survives greyscale printing.
Publication-ready PNG, JPG or PDF.
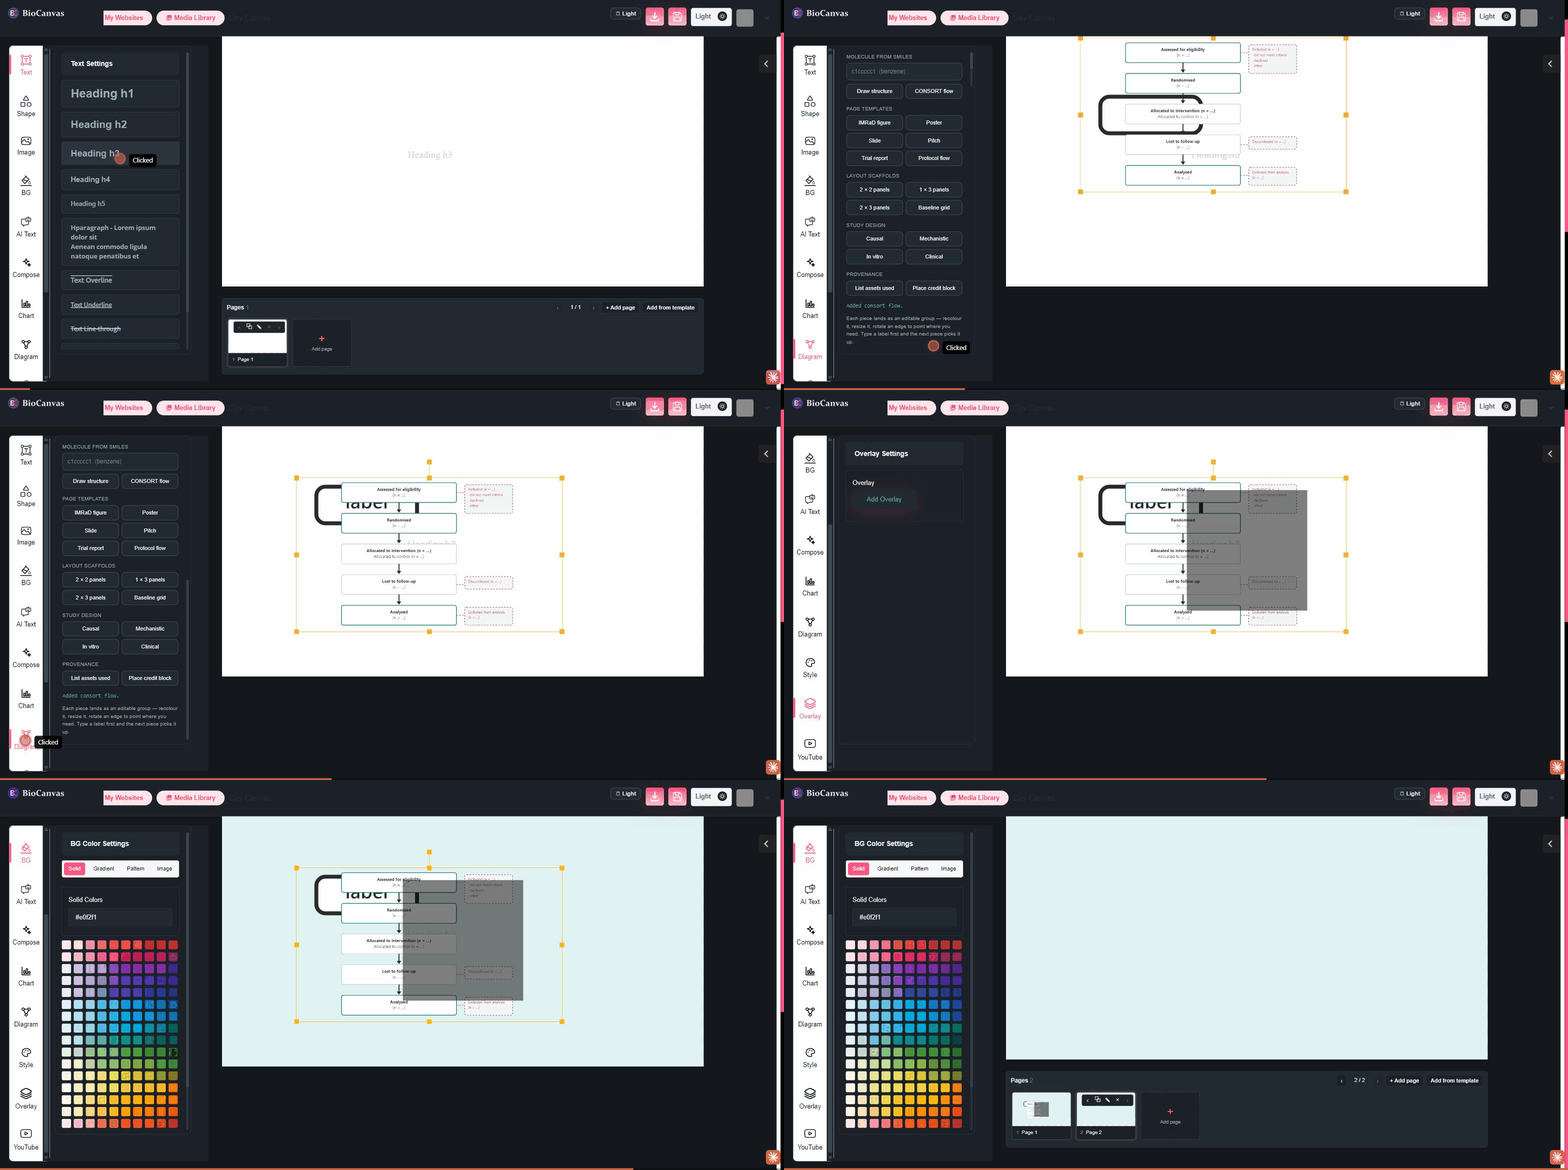
Set the poster title before laying out the rest.
One click assembles the full participant-flow diagram — eligibility through analysis — as an editable group.
Add a callout layer on top without touching the diagram underneath.
Pick a poster background colour and add a second page for the rest of the panels.
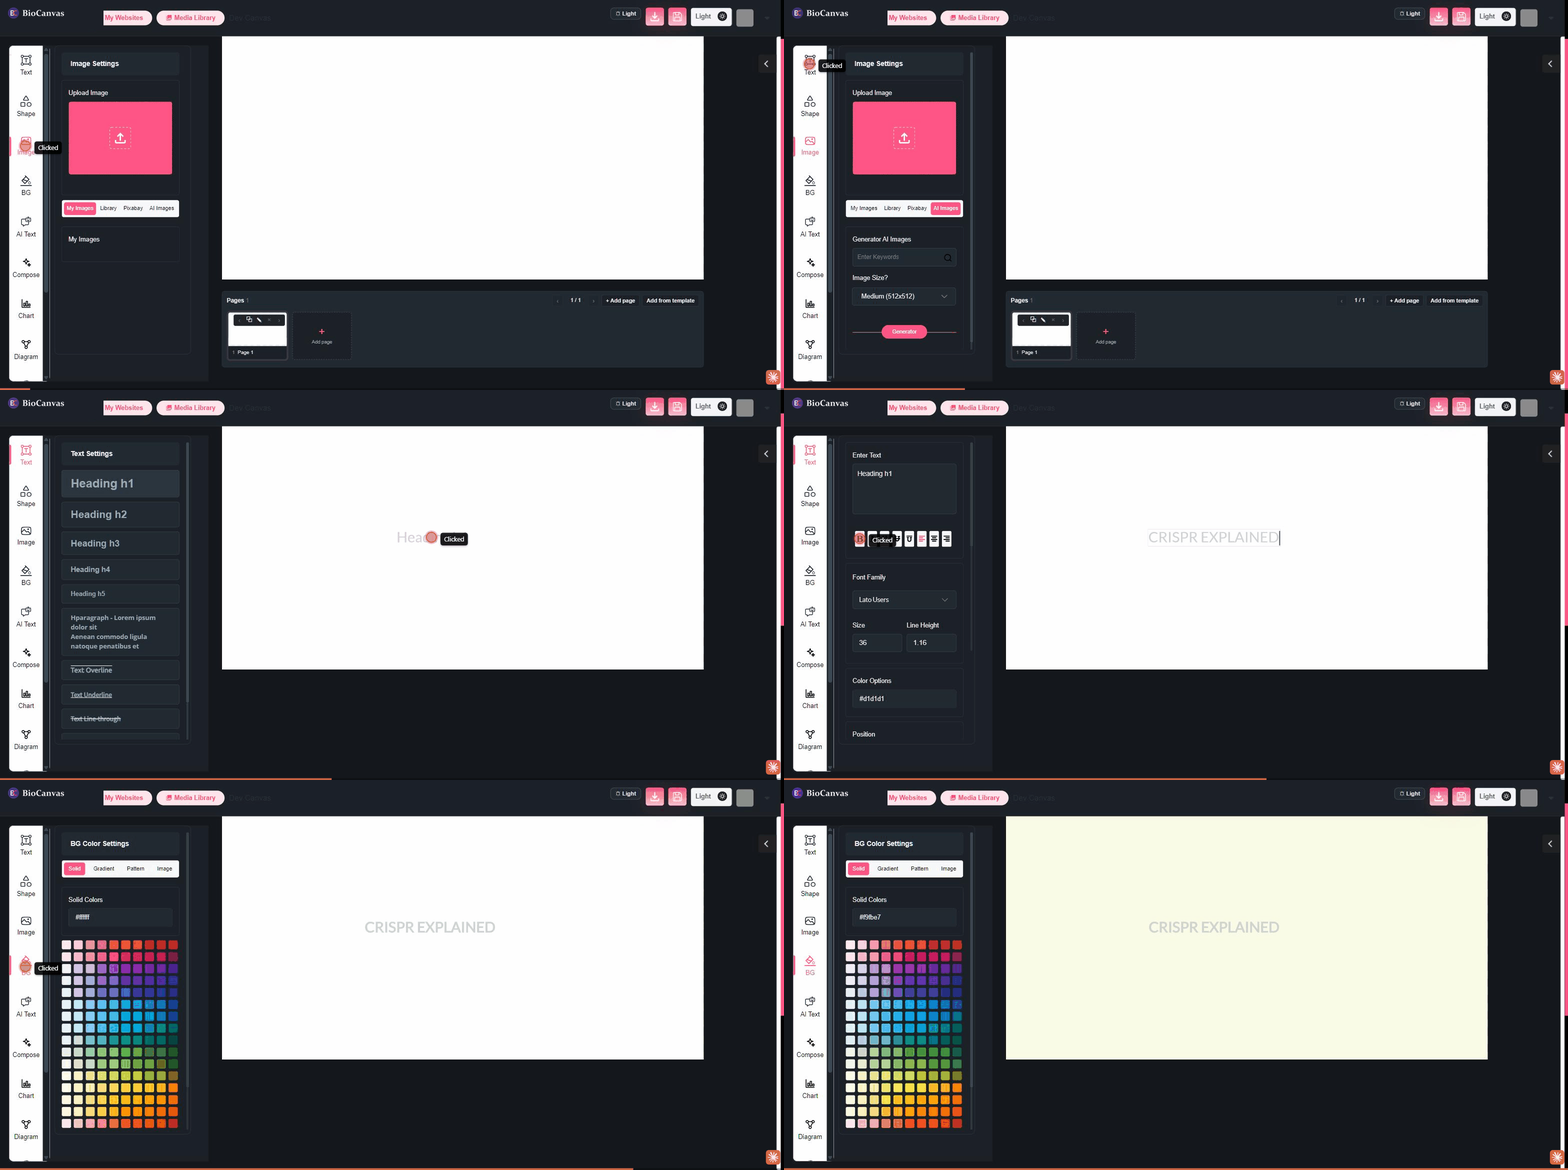
Upload your own photo, or switch to AI Images and generate one from a prompt.
Drop in a heading, edit the text in place, and bold it for thumbnail-scale readability.
A saturated page colour behind bold type — legible at thumbnail size.
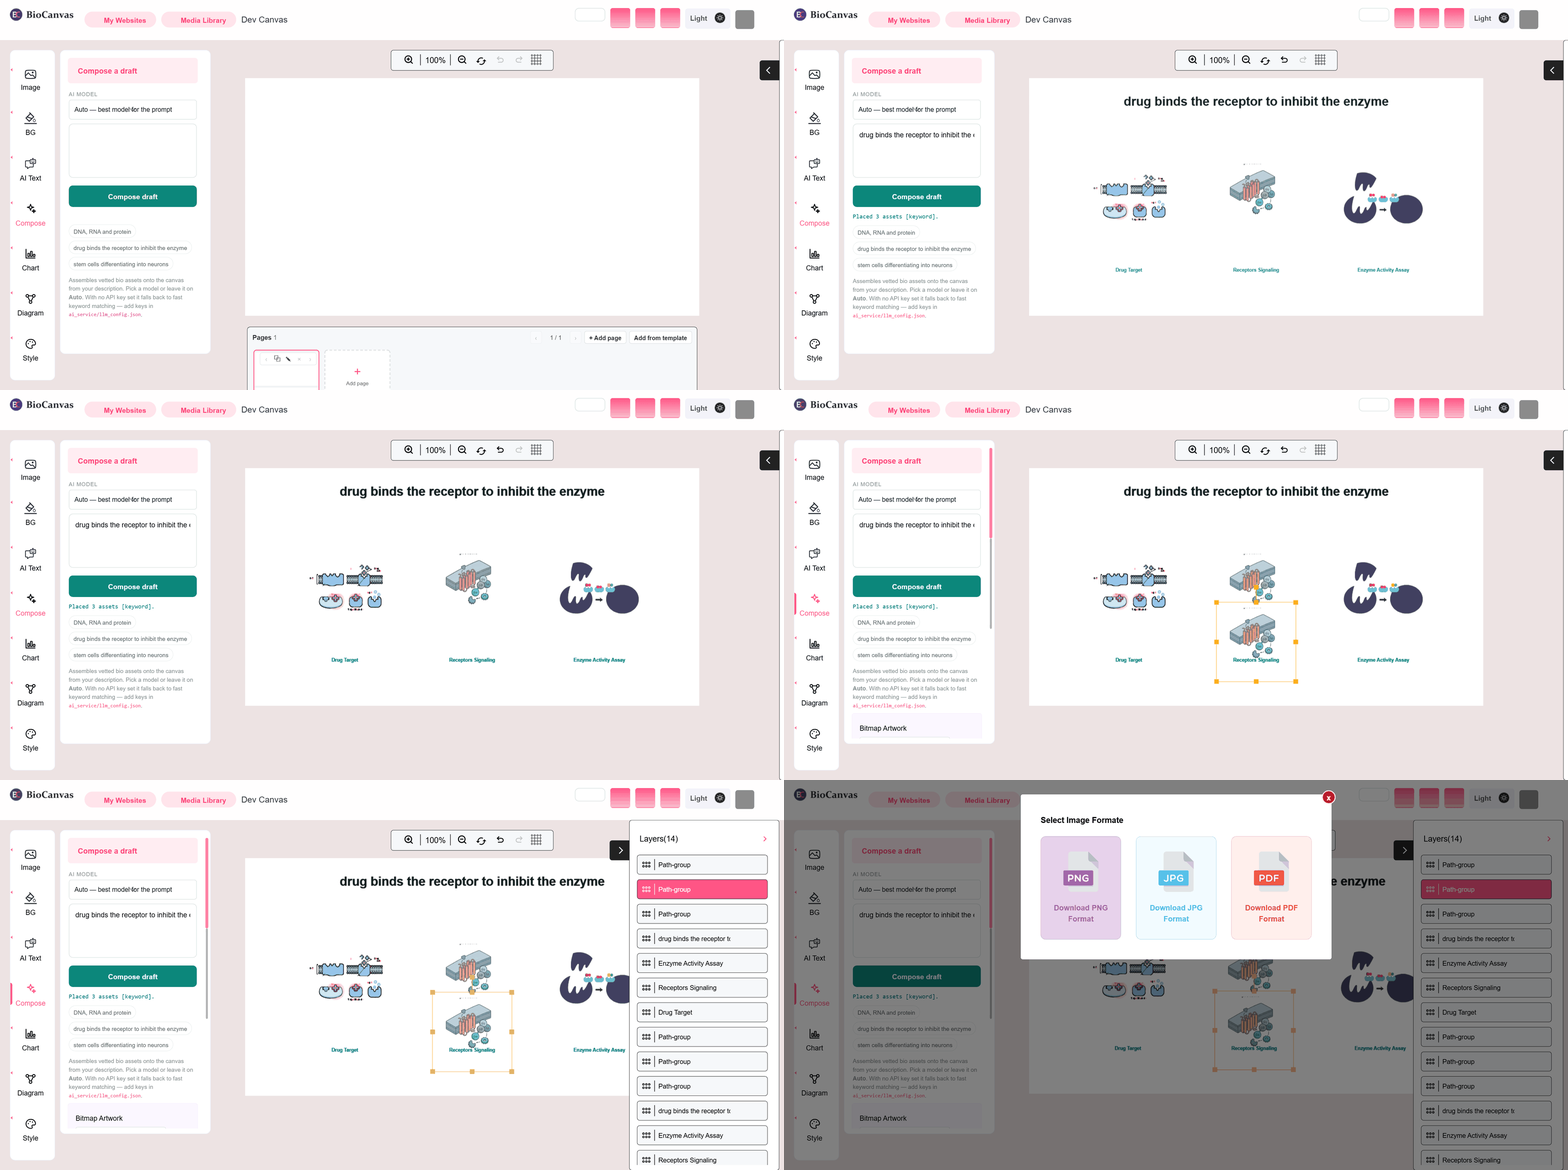
Open Compose and describe the biology in plain language — no illustration-hunting required.
One click assembles the matching vetted assets onto the canvas, correctly labelled.
Every placed piece is a normal, selectable, draggable group — nothing is a flattened image.
Default palettes are chosen for colour-vision deficiency and hold up in greyscale — the two ways a figure usually fails after it leaves your screen.
Every illustration has a genuinely transparent background, so the same figure drops onto a white page or a dark conference slide without a halo.
A saved design remembers exactly which catalogued element each object came from, so a figure can be re-opened, re-coloured and re-exported months later.
Prices in Korean won and US dollars. Cancel any time.
Korean won is the billing currency for accounts in Korea; US dollars elsewhere. Dollar amounts are indicative and settle at the rate on your invoice date. Academic and multi-year pricing is available for departments — ask us.
Yes. Figures you make are yours to publish, including in journals, theses, grant applications, posters and commercial materials. You do not owe BioCanvas a credit line in your figure caption.
No. The scientific illustrations are drawn and reviewed; the charts, structures and diagrams are computed from your input. That is the whole point — a generated picture cannot be checked, and a figure you cannot check is one you cannot defend.
Your designs are private to your account, and on the Institution plan they are visible only to the members you add. Nothing you make is used to train a model — there is no model to train, because the illustrations are drawn and reviewed rather than generated.
Yes — bring in your own images and vectors and place them alongside catalogued elements. Only elements from the BioCanvas library carry the review status.
Yes. Accounts in Korea are billed in Korean won; accounts elsewhere are billed in US dollars. You will see the exact amount in your billing currency before you confirm.
Make it in an hour, from parts that are already right.
Start free